Lidar
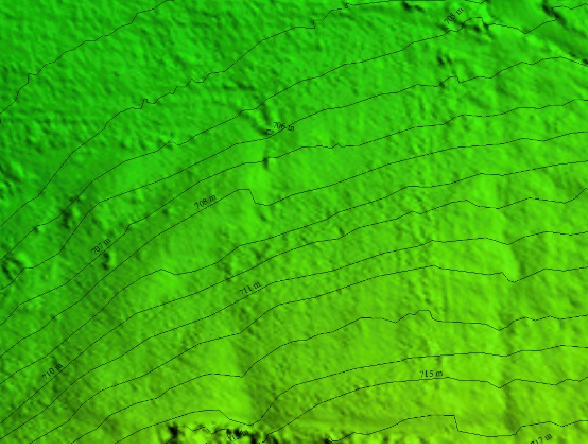
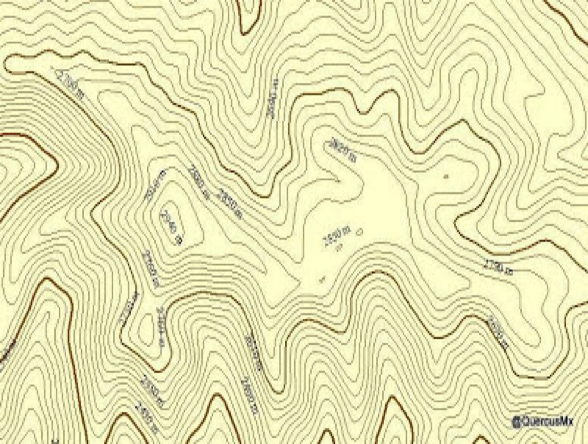
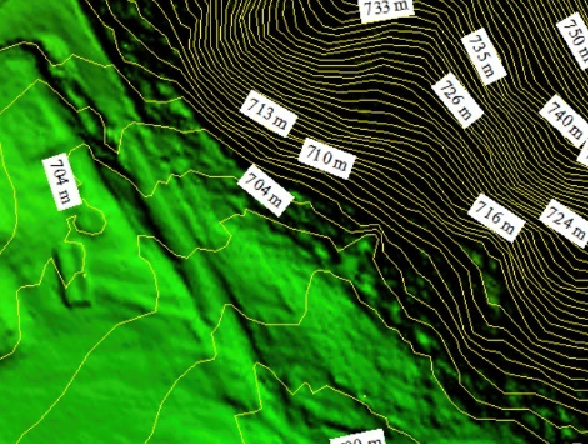
Lidar provides a fast and cost-effective method for producing digital elevation models (DEMs), including reflective surface DEMs from first returns for elevation of above-ground features, and bare-earth DEMs for accurate measurement of the earth’s surface.
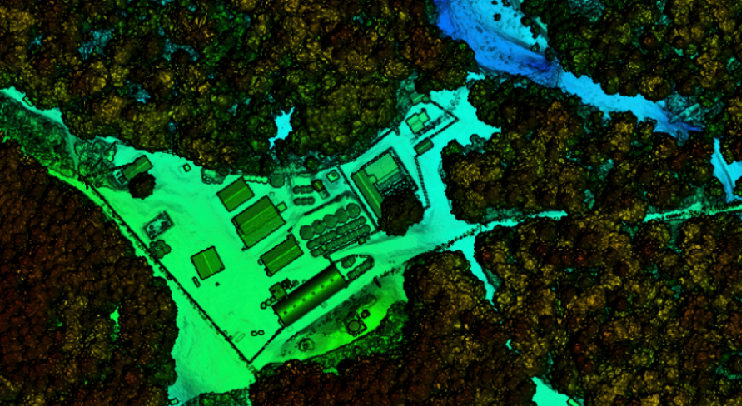
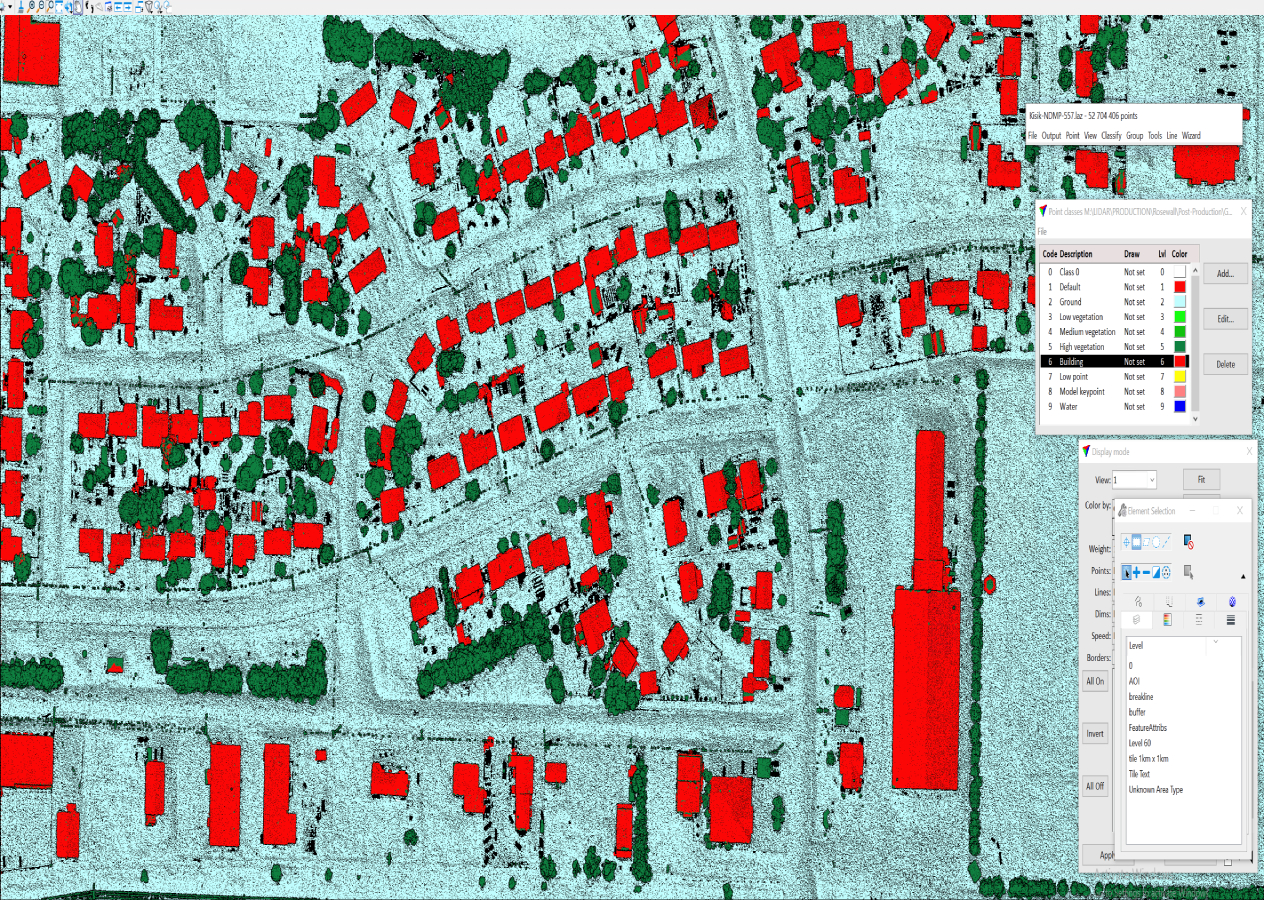
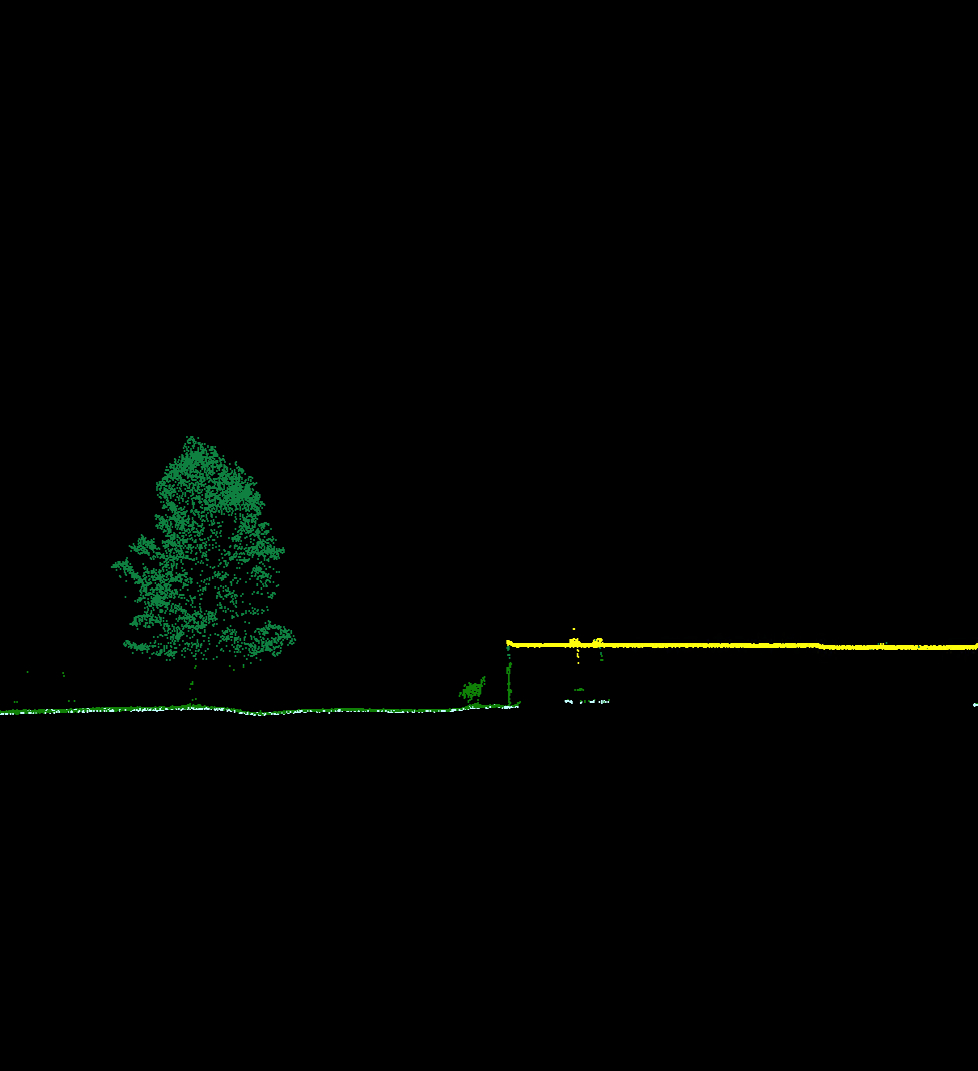
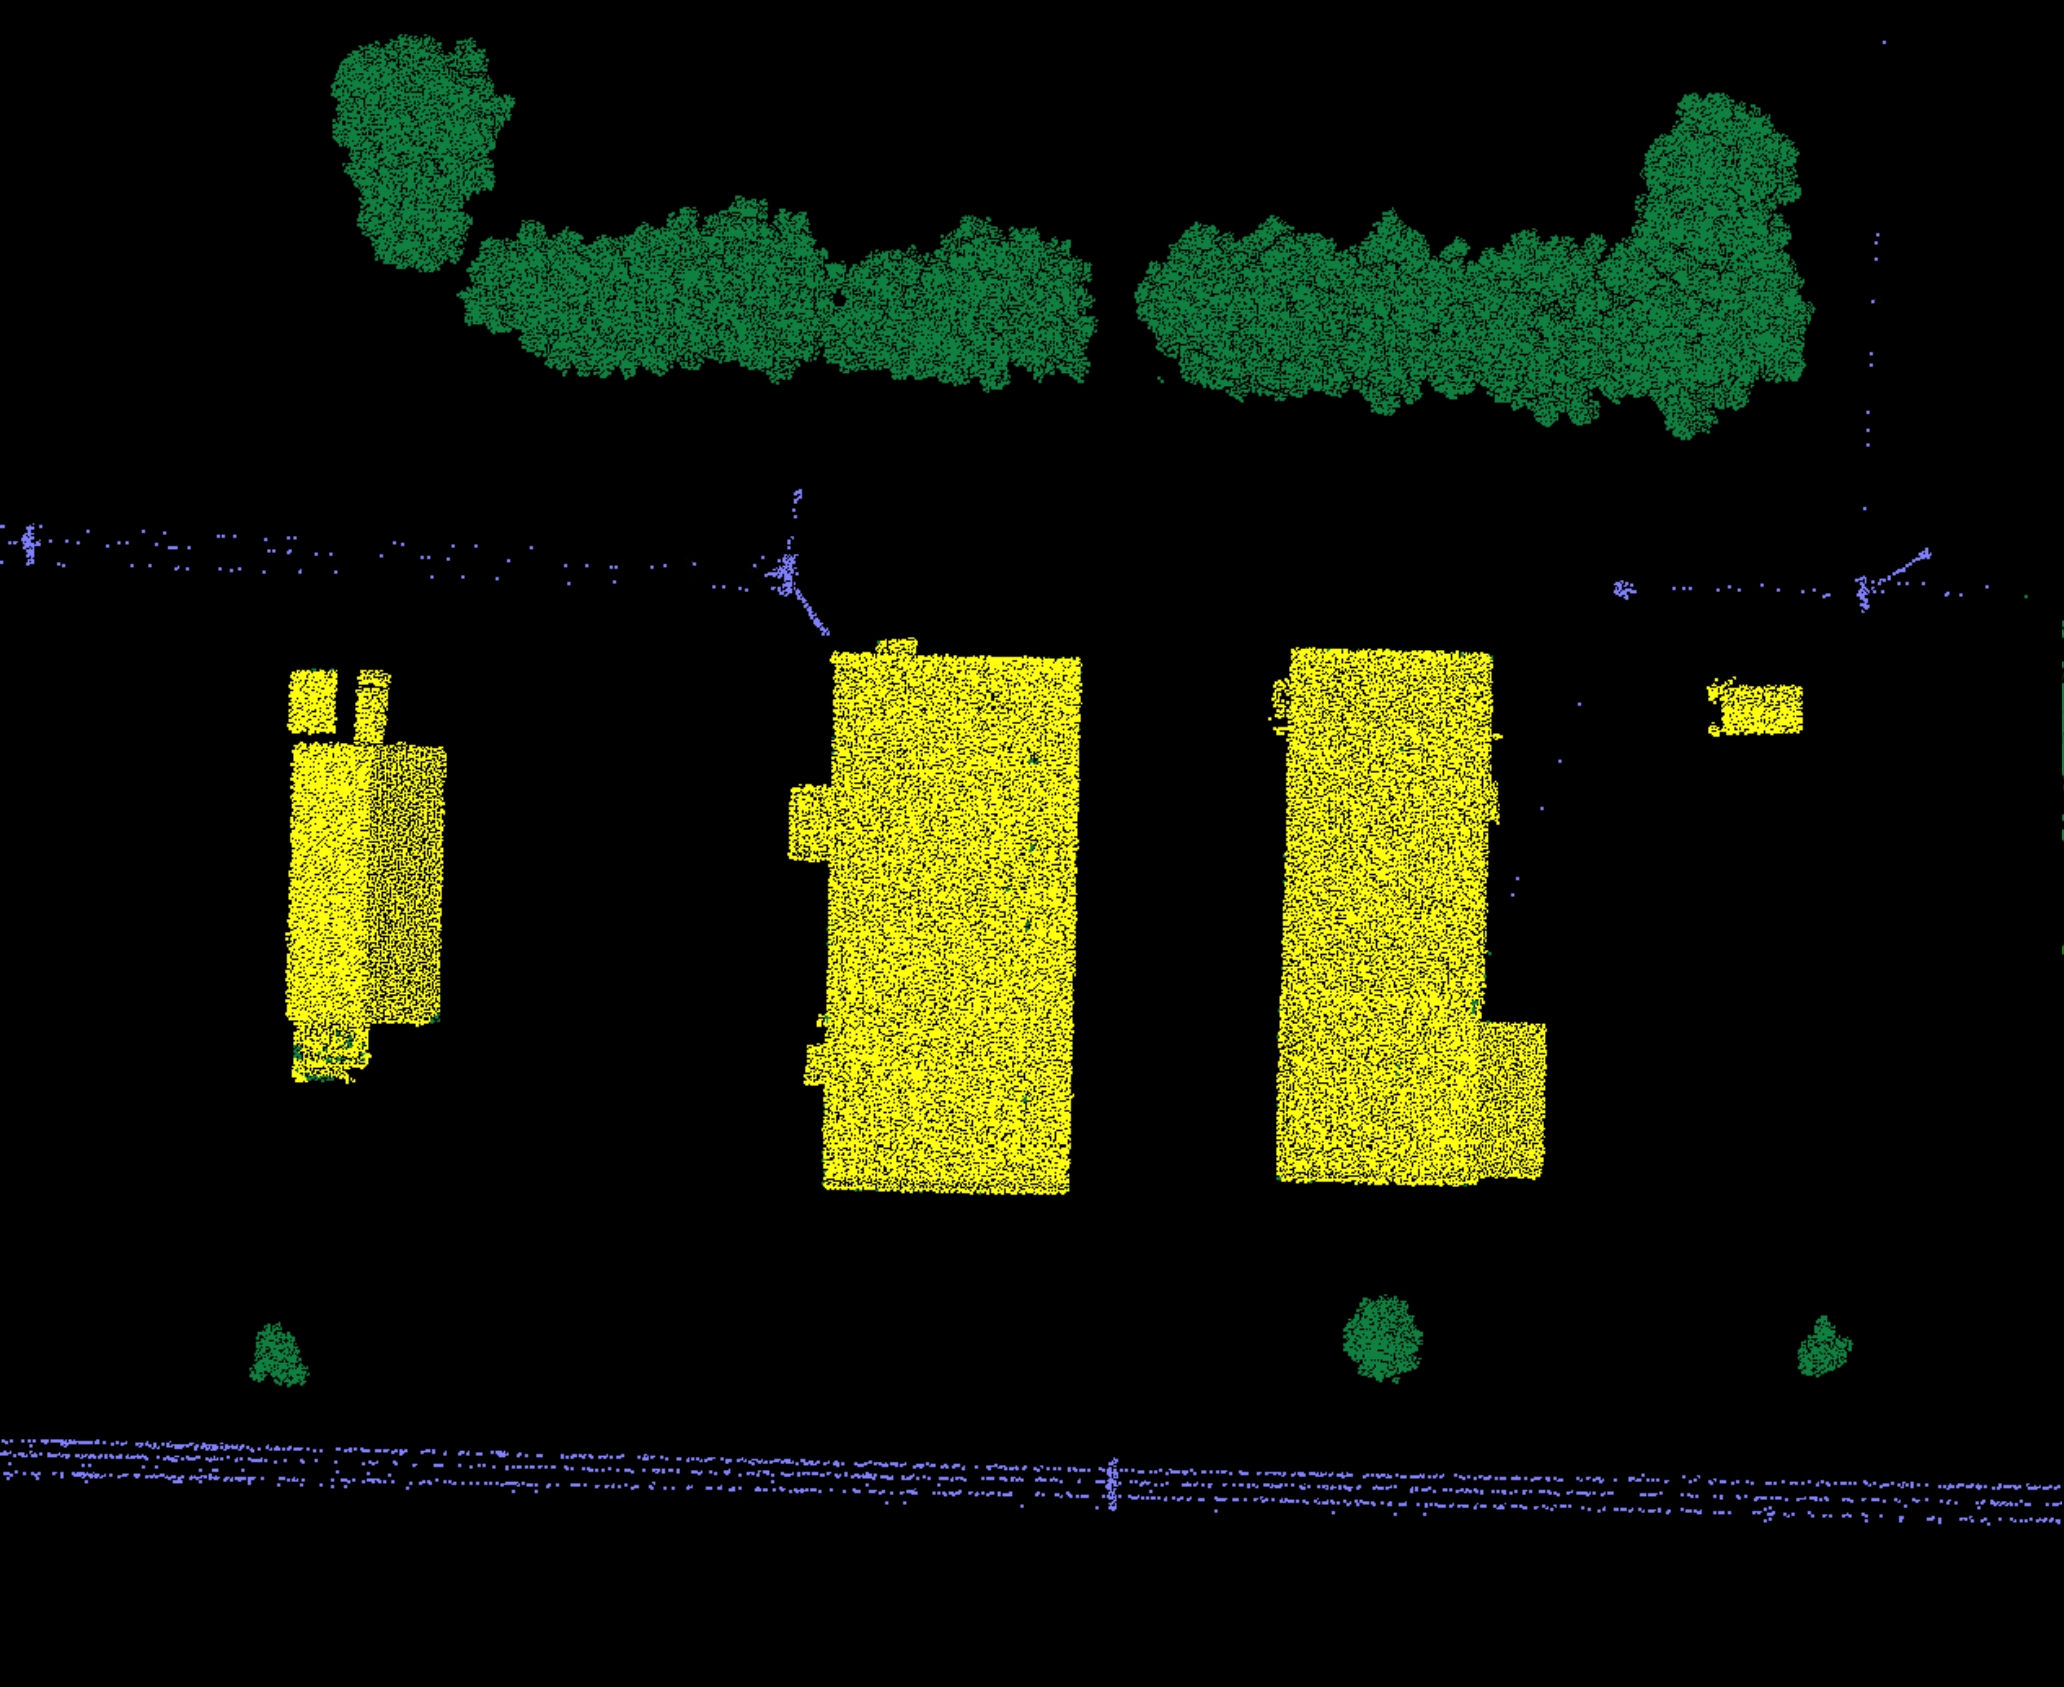
Data Classification
Kîsik meets all the base QL lidar classifications: processed, unclassified, bare earth, low noise, water, ignored ground, bridge decks, and high noise. Additional classifications are available to meet any client-specific requirements, including buildings, culverts, roads, and low, medium and high vegetation.
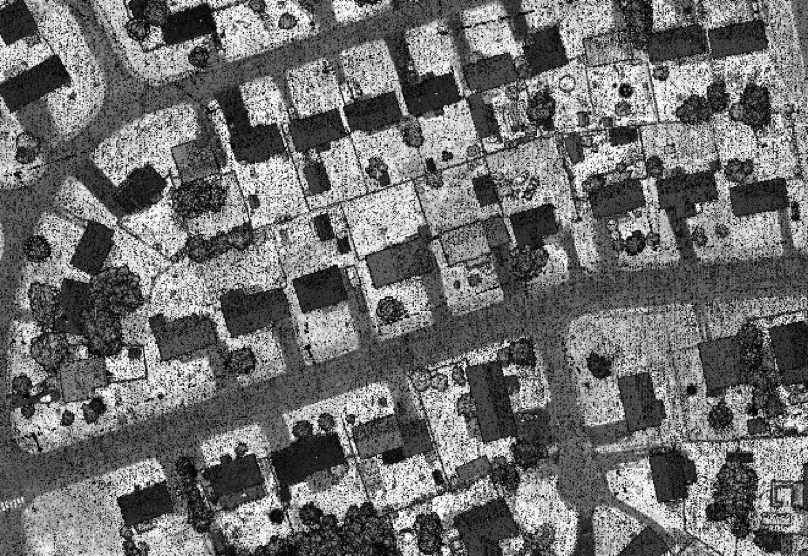
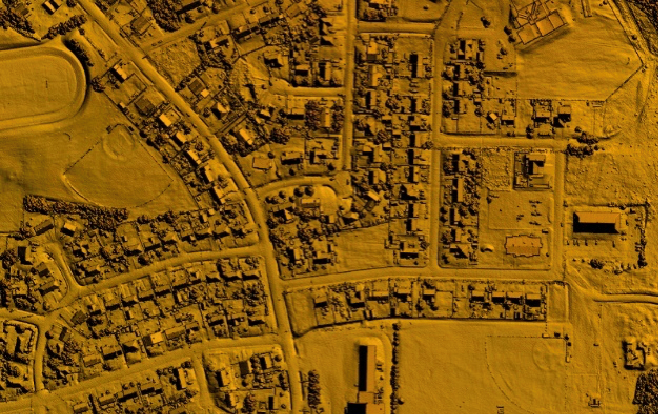
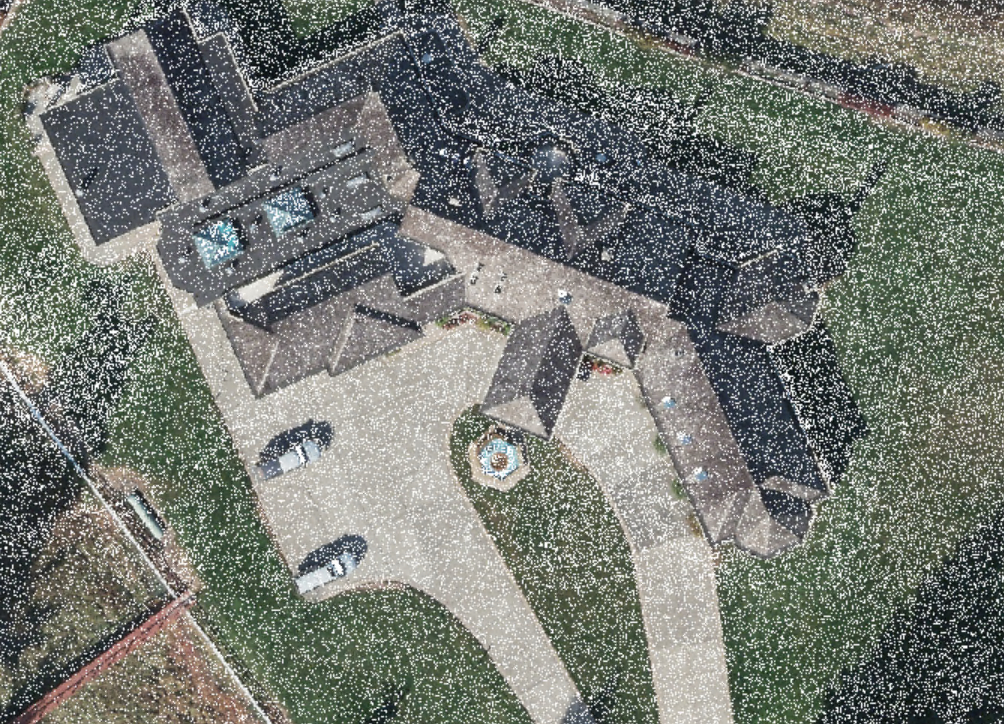
Intensity Images
Georeferenced lidar intensity images look similar to low-resolution photographs. They can be used to extract planimetric features and serve as ancillary input for lidar data processing. Intensity images can also be used to check the horizontal accuracy of the lidar data and other criteria. Intensity is used as an aid in feature detection and extraction, in lidar point classification, and as a substitute for aerial imagery when none is available.

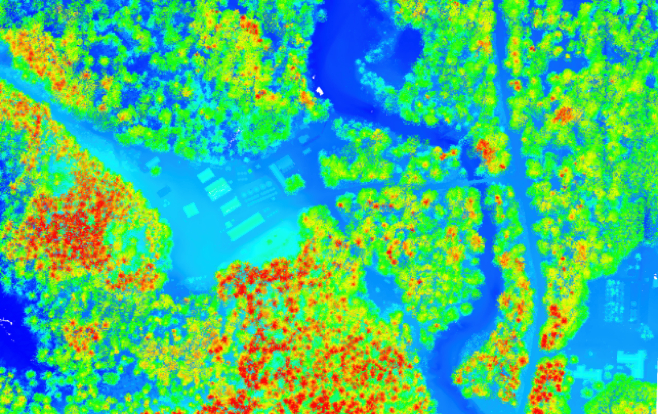
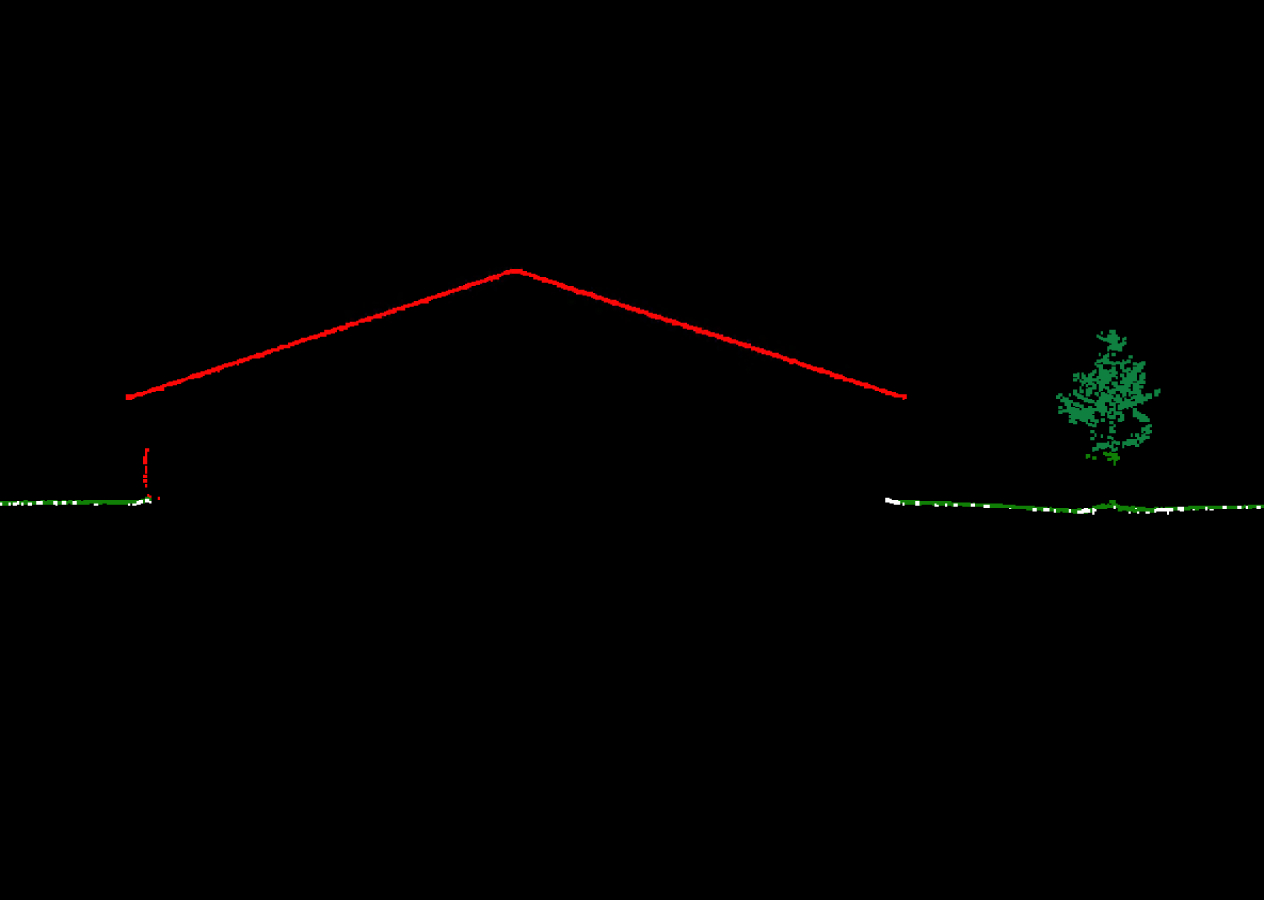
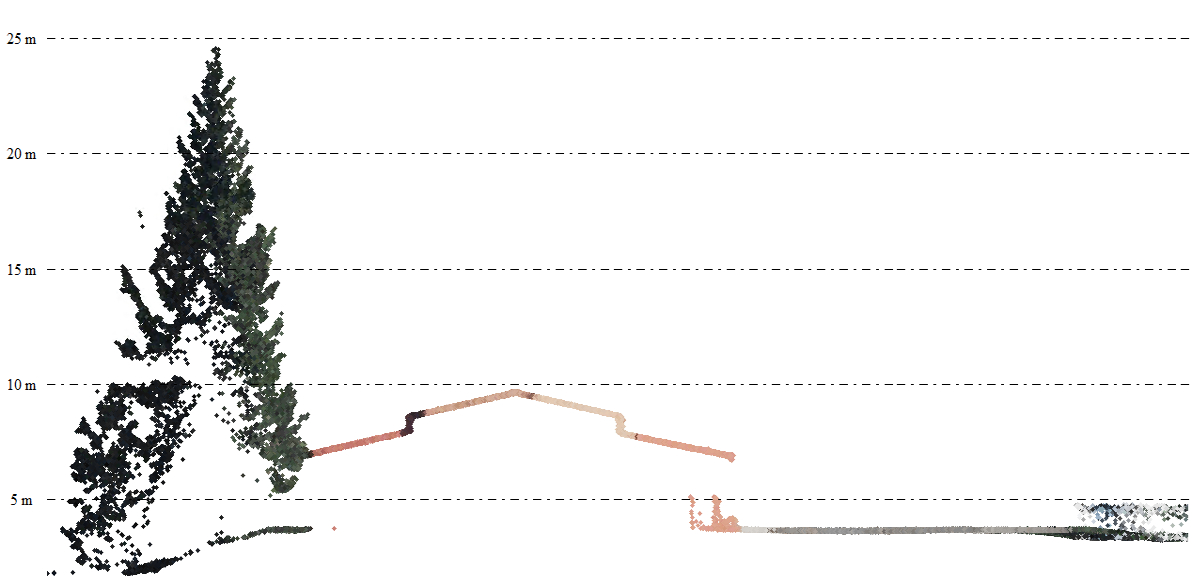
Canopy Height Model (CHM)
Represents the heights of the trees on the ground. The CHM can provide insight into forest health, growth patterns, and changes over time, and can aid in forest management and conservation efforts, such as identifying areas at risk of wildfire, monitoring wildlife habitat, and planning timber harvesting operations.
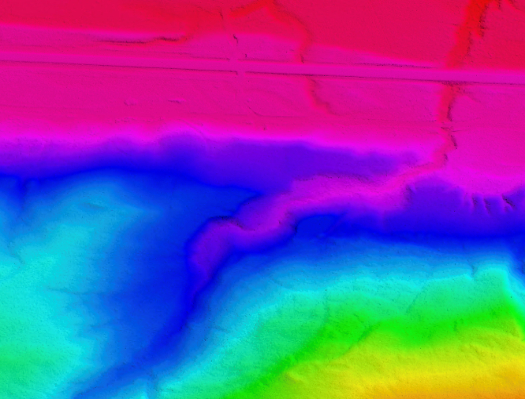
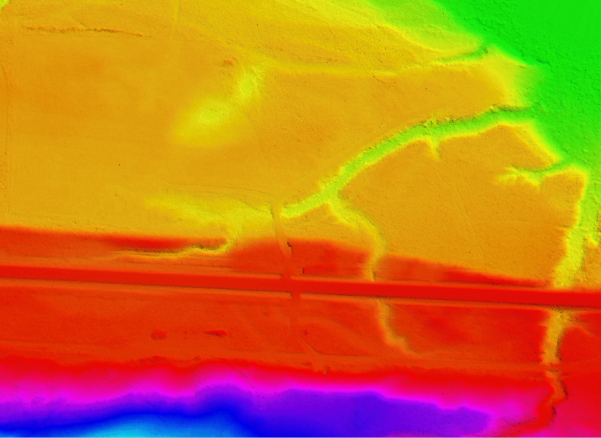
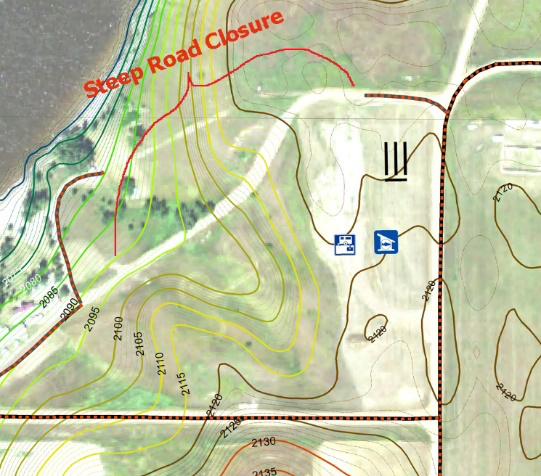
Slope Map
This map provides a colorized representation of slope, generated dynamically using server-side slope function on Terrain service. The degree of slope steepness is depicted by light to dark colors – flat surfaces as gray, shallow slopes as light yellow, moderate slopes as light orange and steep slopes as red-brown
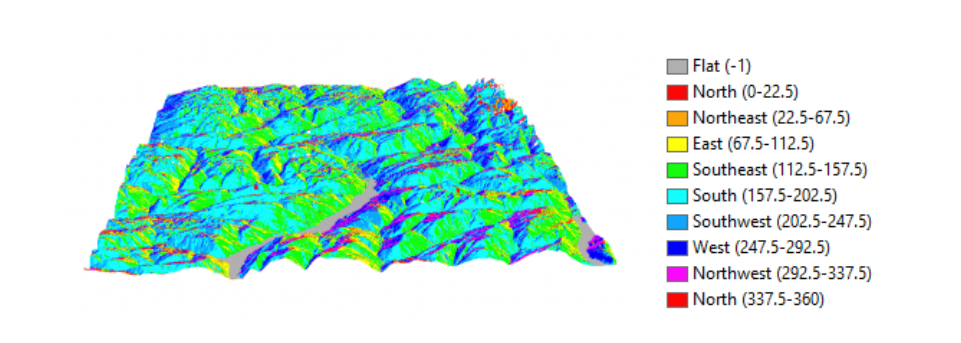
Aspect Map
Aspect values indicate the directions the physical slopes face. We can classify aspect directions based on the slope angle with a descriptive direction. An output aspect raster will typically result in several slope direction classes. The direction a slope faces with respect to the sun (aspect) has a profound influence on vegetation, snowpack, and construction.
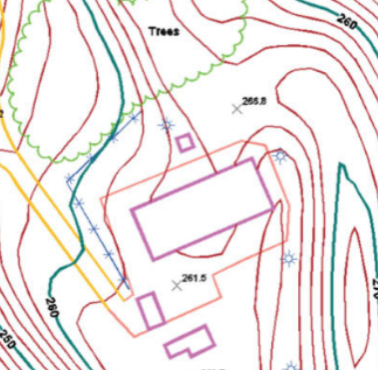
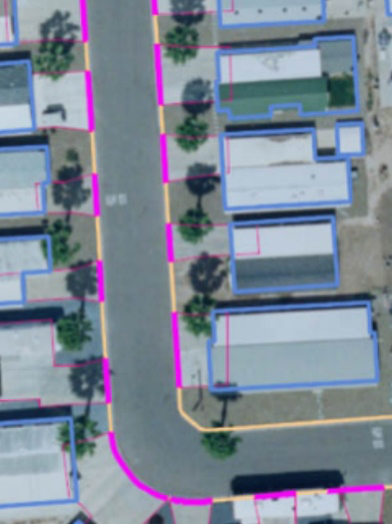
Digitizing Feature and final mapping
The power of GIS is the ability to query specific features against the database table associated with that feature type. in most cases this means that the feature must be in vector form for those operations to occur. It involves the extraction of features, such as roads, buildings, vegetation, and water bodies, from LiDAR point cloud data and aerial imagery.